Introduction
You open Google Search Console one morning, and your impressions have dropped 40%. Rankings look the same. Traffic in Analytics seems fine. But the number staring back at you is alarming.
Before you touch a single page or rewrite a single title tag, there is something you need to know: if you are comparing data across 2025 into 2026, that drop may be a data change, not a ranking problem.
Google Search Console displays your website’s performance prior to a user clicking. For SEO, it is the platform where you can observe which queries activate your pages, the frequency your site shows up in search outcomes, your ranking position, and if users truly click.
When rankings remain steady but traffic fails to increase, the problem is typically evident within the Google search performance report:
- Low CTR
- Weak intent alignment
- Pages showing for the wrong searches
Google Search Console is the provider revealing this data directly from Google.
This guide details the process of examining Google Search performance through Google Search Console, emphasizing the metrics and reports that affect visibility, clicks, and changes in ranking.
What Is Google Search Console?
Google Search Console is a free tool from Google that shows how your website appears and performs in Google Search. It tracks impressions (how often your pages are shown), clicks, click-through rate, and average ranking position using first-party data directly from Google, not estimates from third-party tools.
There are two common misconceptions worth clearing up before going any further.
First, GSC is not a traffic tool. It does not show you how many visitors came to your site; that is what Google Analytics does. GSC shows you how your site performed in search before a user clicked. Think of it as the report that covers what happens in the SERP, not what happens on your pages after the visit.
Second, it is not a ranking tracker. The “average position” metric in GSC is an impression-weighted average across all users, all devices, all locations, and all the times your page appeared in search. A page that ranks at position 3 for one query and position 15 for a related query will show an average position of around 9. That number does not mean your page ranks at 9 for anything specific.
What GSC gives you that no third-party tool can replicate is the actual record of what happened when real users searched on Google and your page was shown. That is the foundation everything else is built on.
At its core, Google Search Console helps you understand:
- Which queries trigger your pages in search
- Which pages receive visibility and clicks
- How Google scans, catalogs and assesses your website
- Where technical or content issues affect performance
If SEO is about visibility, Google Search Console is the source of truth. It shows how Google sees your site, not how tools guess it should perform.
The 2025 GSC Changes Every Analyst Needs to Understand First
Before diving into the data, three 2025 changes permanently altered how GSC numbers should be read. If you are pulling historical comparisons or working with year-over-year data, these are non-negotiable context points.
The September 2025 Impression Reset
Around September 10-11, 2025, sites across every industry saw their GSC impressions drop by 20–50% overnight. An analysis of 319 websites found that 87.7% of sites were affected. Rankings were stable. Actual organic traffic in Google Analytics was unchanged. But impression counts collapsed.
What happened: Google removed support for a URL parameter called &num=100. This parameter has allowed SEO crawlers and rank-tracking tools to retrieve 100 search results in a single request, rather than the standard 10. Those automated requests were being counted as impressions in GSC. When Google removed the parameter, it stopped counting those non-human views, and impression totals fell sharply to reflect only actual user searches.
What this means for your data
If you are comparing impression data from before September 8, 2025 to data from after, you are not comparing like with like. Use September 8, 2025, as your reset point. For year-over-year comparisons through 2025, use Analytics clicks rather than GSC impressions as your primary traffic signal. The clicks’ data was not affected, only the impressions.
One interesting side effect: because impressions dropped while clicks held steady, CTRs improved and average positions appeared to get better for many sites. This was not a ranking improvement. It was a cleaner dataset. Pages ranking beyond position 20 generated most of the artificial impressions, so removing them lifted the average position figure.
The May 2025 Inflated Impressions Period
Before the September reset, there was a separate problem running in the opposite direction. Google confirmed that a logging error caused Search Console to over-report impressions starting May 13, 2025. Clicks and other metrics were not affected; only impression counts were inflated.
If your impression reporting looked unusually high between May and early September 2025, that period should be treated with caution for trend comparisons. Google confirmed the fix was rolled out gradually, not on a single clean date.
The practical upshot: avoid doing year-over-year impression comparisons using any data between May 13 and September 12, 2025. Use clicks and qualified traffic as your benchmarks for that period instead.
AI Mode Data Now Lives Inside Your Web Search Totals
Since mid-2025, AI Mode search data has been folded into the Web Search Performance report rather than reported separately.
Unlike previous SERP features that received separate reporting, AI Mode does not get its own tab. Its impressions and clicks are folded into your regular web search totals.
You cannot currently isolate AI Mode performance from traditional blue-link performance within GSC. If you notice CTR dropping while positions hold steady, which is exactly the pattern AI overviews produce, that is likely AI mode absorbing visibility without a corresponding rise in clicks.
According to GrowthSRC’s study of 200,000+ keywords, position 1 organic CTR dropped 32% from 2024 to 2025, largely driven by AI Overview coverage expanding from 10,000 keywords in 2024 to 172,855 keywords by May 2025.
By early 2026, AI Overview coverage has continued to expand, making this trend more pronounced than these figures suggest
The positions 6–10 reversal
Here is something counterintuitive from 2025 data: positions 6–10 saw clicks increase by around 30% in 2025 compared to 2024, a trend that has continued into 2026 as AI Overviews consolidate zero-click behavior at the top of the SERP.
The theory is that AI Overviews push users who are looking for quick answers toward zero-click results at the top, while users who want to read deeper content now scroll further and engage with positions 6–10.
If your pages sit in these positions, they may be undervalued in your current analysis.
Understanding the Google Search Console Performance Report
When you access Search Console, you may find up to three Google Search Performance reports in the navigation:
- Search Results:
This report provides data for Google Search impressions, clicks, and positions, covering the Search, Image, Video, and News tabs within Google Search. Because it includes additional analytical capabilities, this report is often the focus.
- Discover:
This report shows data, such as impressions and clicks, from Google Discover. It is only visible if your property has reached a minimum number of impressions in Discover.
- News:
This presents data from news.google.com and the Google News app on Android and iOS. Crucially, it does not include the News tab within Google Search (that is covered in the Search Results report when filtered). It is only visible if your property has reached a minimum number of impressions in Google News.
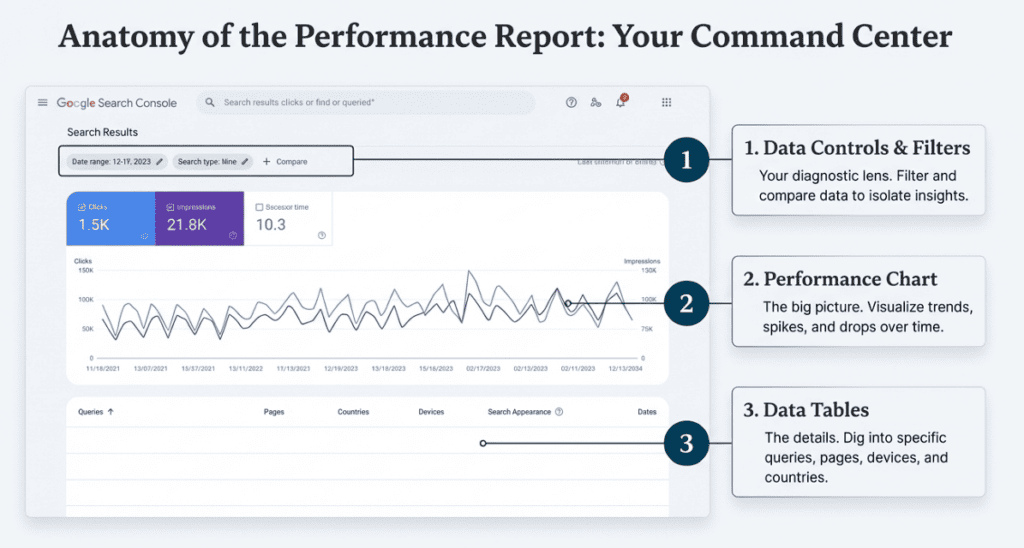
The core of the analysis takes place within the Google Search Performance report, which features three main elements: the data controls and filters, the chart area, and the table section.
What Are Filters in Google Search Console?
Filters in Google Search Console allow you to separate data, enabling you to examine performance without distractions. Then, viewing every query and page simultaneously, filters assist you in addressing targeted questions such as the reasons for why clicks dropped, which pages underperform, or where visibility is growing.
Filters don’t change your data. They change how you view it.
Inside the Search Results Performance report, filters sit at the top and control what appears in both the chart and the table.
How to Use Filters Without Wasting 45 Minutes
Most people use the date filter and nothing else. Here are the four filter combinations that actually change how you diagnose problems.
- Date Range: The Comparison Mode Trap
The default three-month view is almost useless for diagnosis. What you need is the compare mode. Specifically:
• Last 28 days vs previous 28 days: for catching issues that developed recently
• This month vs same month last year: for separating seasonal patterns from real decline
• Post-September 8, 2025 only: for any impression analysis, use clean post-reset data
When a client reports that traffic dropped, the first thing to check is whether the drop is in clicks or impressions. Open the date comparison, select a period that straddles the change you see, and look at which metric moved. If clicks fell and impressions held, something changed about your listing or the SERP. If both fell proportionally, you likely lost ranking. If only impressions fell, but after September 2025, it was probably the data reset.
- Search Type: Check Your Image and Video Traffic
The default shows Web search only. If your site relies on images, photography, e-commerce product shots, or infographics, you should be monitoring the image search tab separately. A site can be losing image traffic entirely while its Web rankings look healthy.
You can compare two search types simultaneously. If you run a recipe or tutorial site, comparing web and video in the same view shows you whether the YouTube content is complementing or cannibalizing your web listings.
The Branded vs Non-Branded Split (Now Native in GSC)
Since late 2025, GSC has offered branded vs. non-branded filtering natively in the Query section, removing the need for Sheets workarounds or third-party tools.
Why this split matters
Branded queries (searches that include your company name, product name, or domain) indicate existing awareness; people are looking for you specifically. Non-branded queries are where SEO actually lives: strangers finding you through the topic, not the name. If your click growth is entirely branded, your SEO is not growing. If non-branded impressions are growing but CTR is dropping, AI Overviews may be answering your queries before users reach you.
Query Filters for Intent Analysis
The query filter lets you include or exclude specific words. Practical applications:
• Filter queries containing your primary keyword to see all variations driving impressions
• Exclude branded terms to see non-branded performance in isolation
• Filter by a subfolder (using the Page filter) to analyse blog performance vs product pages separately
• Filter by device to check whether a CTR problem exists on mobile, desktop, or both
Search Performance Chart Area
After setting the controls, the chart area provides a quick overview of what the data tells you.
Key Metrics: Impressions, Clicks, CTR, and Position
| Metric | What it measures | What it reveals | Warning: do not misread it as |
| Impressions | How many times your page appeared in Google search results (post-Sept 2025: real users only) | Your visibility, whether Google is showing you for a topic at all | Traffic. Impressions require no click and no visit. |
| Clicks | How many times a user clicked your result from the search page | Actual demand flowing from search to your site | Unique visitors. One user can click multiple times. |
| CTR | Clicks divided by impressions, expressed as a percentage | How compelling your listing is relative to what surrounds it | Quality of traffic. A 40% CTR on a junk query is still junk. |
| Average Position | Impression-weighted mean ranking across all searches that triggered your page | A trend signal’s direction matters more than the exact number | Your rank for a specific query. It is an average across many. |
The pattern that matters most is clicks-to-impressions direction over time. Impressions rising while clicks hold flat signals a visibility gain that is not converting, usually a CTR problem. Impressions stable while clicks fall signals a CTR deterioration without a ranking change, often caused by SERP features like AI overviews eating the top of the page.
Performance Monitoring and Audience Insight
Just by observing the shape of the line in the chart, you can glean a lot about your audience and performance. For instance, a development site might show significantly more searches during weekdays than weekends, reflecting its professional audience. You should use the chart to monitor drops or spikes in traffic and begin your journey to understand them.
Custom Chart Annotations (The Insider Feature)
A favorite feature among experts is the use of custom chart annotations. Adding annotations is a powerful way to add context to events that may be affecting your Google Search performance.
- You can use them to mark important moments, such as launching a new feature or fixing a bug on your website.
- To add an annotation, right-click the chart on the desired date, type your note, and click “Add.”
- These annotations will appear for everyone with access to the property, regardless of applied filters, though they do not show up in comparison mode or 24-hour views.
The Table Section: Where Actual Diagnosis Happens
The chart tells you something changed. The table tells you what changed and where. Here are five specific ways to use the table that most guides skip.
Analysis 1: The High-Impression, Low-CTR Opportunity
Sort the Queries tab by Impressions (descending). Now look at the CTR column alongside each query. Any query with 1,000+ impressions and a CTR below 3% when your position is between 3 and 8 is an immediate opportunity.
To show what the math looks like: a page at position 5 with 3,000 monthly impressions and 2% CTR generates 60 clicks per month. The expected CTR for position 5 in 2025 is around 6–8%. Improving to 6% generates 180 clicks from the same ranking, a 3x gain without moving a single position. That comes from rewriting the title and meta description to better match what the user is actually looking for when they type that query.
The common mistake here is rewriting for keyword density. The fix is writing for the user’s next thought. If someone searches “Google Search Console impressions explained” and your title says “Google Search Console Guide,” you are missing the specificity they need to click.
Analysis 2: Pages Missing from the Table
Switch to the Pages tab. Check whether your highest-value pages, your money pages, and your cornerstone content appear in the list. If an important page is absent, it is either not indexed or not ranking for any query that generates impressions.
The fix: go to URL inspection, paste the page URL, and check its indexing status. If it is indexed but getting no impressions, the keyword targeting may be wrong, the page may be too thin, or there may be a canonicalization issue sending Google elsewhere.
Analysis 3: Queries That Trigger Pages You Did Not Intend
Click any page URL in the Pages tab. GSC will automatically filter the Queries tab to show only queries that triggered that specific page. What you are looking for are queries that do not match the page’s purpose.
A service page showing up for informational research queries means you have a content gap; users want an answer, and Google is sending them to a page that sells instead of explains.
Either create a supporting blog post or add an explanatory section to the service page that genuinely answers the research question before transitioning to the commercial message.
Analysis 4: The Device Split
Switch the dimension to Device. Select mobile only. Now check your CTR for top queries on mobile vs. desktop. A page with a 15% CTR on desktop and 4% CTR on mobile has a mobile title problem. Titles on mobile are typically truncated earlier, and if the meaningful part of your title is cut off, users do not click.
Mobile titles display around 55–60 characters before truncation depending on the device. Front-load the most important words. If your title is “How to Use Google Search Console for SEO Performance Analysis in 2025,” mobile users see “How to Use Google Search Console for SEO Perform…,” which is adequate. But “Complete Guide to Google Analytics and Search Console: A 2025 Performance Analysis for Digital Marketers” truncates to “Complete Guide to Google Analytics and Search Console…” The specific value is never shown.
Analysis 5: Country-Level Performance Gaps
Switch to the Countries tab. If your site targets multiple markets, you may find that pages ranking well in one country are barely visible in another. This often indicates a content localization gap; the language is technically correct, but the framing, examples, and terminology do not match how users in that market search.
India, for example, often has different search phrasing patterns for the same topic than the UK or US. If you run a digital marketing agency serving multiple markets, a country filter quickly surfaces where content investment will pay off.
Analysing Queries vs Pages: What to Focus On
By analyzing the tables, you can diagnose issues and determine the necessary SEO action:
| Observation | Diagnosis | SEO Action |
| Expected queries missing | Content Gap | Create more useful, relevant content |
| Important pages missing | Technical/Indexing Issue | Use the inspect URL to find the cause |
| High Impressions/Low Clicks (Low CTR) | Presentation/Relevance Issue | Add images or structured data to increase attractiveness |
Query Groups: The October 2025 Feature That Replaces Your Spreadsheet
Query Groups, which Google added to Search Console Insights in October 2025, have now been available for several months and is widely rolled out for properties with sufficient query volume.
What Query Groups does
Query Groups uses AI to analyze Search Console data to cluster similar search queries into topic-level groups. Instead of seeing 200 slightly different phrasings of the same question, you see that topic as a single group with total clicks and indicators showing whether it is trending up, trending down, or top (highest volume). You can click any group to drill into the individual queries inside it.
This is available in Search Console Insights (not the main Performance report) and only for properties with large enough query volumes. If you do not see it yet, it will roll out gradually.
Three practical uses for Query Groups:
1. Spot declining topic areas before they show in traffic data. A group marked “Trending Down” has weeks before you see the impact in clicks. Investigate the top pages for that group now and update them.
2. Identify cannibalization across pages. If multiple URLs are competing for the same query group, GSC will show you the split. Consolidating or differentiating those pages can concentrate performance.
3. Replace manual keyword research for content gaps. A topic group with growing impressions but a low CTR is a topic where you are visible but not a compelling, strong candidate for a dedicated, better-targeted piece of content.
Note: Be aware that the September 2025 baseline change affects impression counts inside Query Groups too. Groups labeled Trending Down after September 2025 should be cross-checked against clicks (not just impressions) to confirm whether the topic is genuinely losing traction.
AI-Powered Configuration: GSC’s Analysis Shortcut
Google’s AI-powered configuration feature, which lets you type natural language requests to set up filters automatically, has been available since late 2025 and continues to roll out across accounts. It currently works only in the Search Results Performance report.
Examples of what you can ask it:
• “Show me queries on mobile searches that contain the word ‘analytics’ in the last 6 months.”
• “Compare traffic for my blog pages this quarter versus the same quarter last year.”
• “Show clicks for pages that rank between position 5 and 10 with CTR below 3%”
It currently works only in the Search Results Performance report and cannot sort tables, export data, or perform actions, but for report setup, it removes the manual filter work entirely. Google has flagged it as experimental and rolling out gradually, so not every account will see it immediately.
For a step-by-step framework for acting on these findings, see our technical SEO audit checklist.
Four Workflows That Turn GSC Data into Decisions
Workflow 1: The CTR Repair Pass
Run this monthly. It consistently produces traffic gains without needing ranking improvements.
1. Go to the Queries tab. Sort by impressions descending. Add the CTR column.
2. Filter to show queries where your average position is between 3 and 12.
3. Identify every query where CTR is below 4% at position 3, below 3% at position 5, or below 2% at position 8.
4 Click each underperforming query to see which page is ranking for it.
5. Rewrite that page’s title tag and meta description. Match the exact language of the query. Add the specific benefit or outcome the user is looking for.
6. Use the annotations feature to mark the date of each change.
7. Wait 3–4 weeks. Check whether CTR improved for those queries.
Stop writing meta descriptions as summaries of your page. Write them as a response to the user’s search intent. If the query is “Google Search Console impressions not counting correctly,” your meta description should immediately acknowledge to Google Search Console that problem and signal that you have the explanation.
Workflow 2: The Positions 4–10 Push
Pages ranking between position 4 and 10 are already understood by Google as relevant for the query. The work to move them into the top 3 is usually content depth, not backlinks.
. Filter the Pages tab to show only pages with an average position between 4 and 10.
1. Sort by Impressions to prioritize high-visibility pages.
2. Click each page to see the queries it ranks for.
3. Open the page and compare it against the top 3 results for its primary query. What do those pages cover that yours does not? Add it.
4. Improve the structure: break long text blocks into headings, add a clear answer near the top, and remove sections that do not serve the user’s core intent.
5. Add 1–2 internal links from stronger pages pointing to this page.
As of 2025–2026, pages in positions 4–10 consistently outperform historical norms, a pattern that has now held for over a year.
This workflow is higher value than it was two years ago.
Workflow 3: Content Gap Detection
This workflow finds topics where Google is already showing you but you are not winning the click.
1. Go to the Queries tab. Sort by impressions descending.
2. Scroll through and note every query that you do not recognize as a topic you have written about.
3. Click each query to see which of your pages Google is sending it to.
4. If Google is routing an informational query to a commercial page, you are missing a piece of content. Create it.
5. If Google is routing it to a blog post but that post does not answer the query clearly, update the post to address it directly with a dedicated heading for that query.
This is how established sites grow without chasing new keywords. Google tells you what queries are adjacent to your existing content. You fill the gap.
Workflow 4: Early Technical Issue Detection
Performance data drops that are not explained by content or CTR issues usually have a technical origin. GSC reveals these in a specific pattern.
1. If impressions drop suddenly across many pages at the same time, check the Coverage report for crawl errors and the URL Inspection tool for indexing issues.
2. If a specific page drops while others are stable, inspect that URL. Common causes: accidental noindex added during a CMS update, canonical pointing to the wrong URL, or a redirect loop.
3. If mobile CTR drops while desktop holds, check Core Web Vitals for mobile. LCP (Largest Contentful Paint) issues affect CTR indirectly by creating a slow first impression that users bounce from.
4. If position drops sharply on certain pages after a content update, compare the old and new versions. Was the primary keyword moved lower on the page? Was the H1 changed? Was the internal linking structure altered?
What Good Performance Looks Like
Every client wants to know what they should be seeing. Here is a realistic framework based on search data, not benchmarks from three years ago.
| Position | Expected Desktop CTR (2025-26) | Expected Mobile CTR (2025-26) | What to do if you are below this |
| #1 | 19–25% | 17–22% | Structural issue: AI Overview may be above you. Check SERP manually for that query. |
| #2 | 11–15% | 9–13% | The title is likely too generic. Rewrite with specific benefit or outcome. |
| #3 | 8–12% | 6–10% | Strong candidate for CTR repair workflow. Investigate what #1 and #2 say. |
| #4–5 | 5–8% | 4–7% | Page-level work: add clearer structure, improve loading speed on mobile. |
| #6–10 | 3–6% | 2–5% | Positions 6–10 are growing in value (2025 data). Prioritise content depth updates. |
| #11–20 | 1–3% | 0.5–2% | Page 2 requires meaningful content improvement, not just meta rewrites. |
These are directional benchmarks, not absolutes. CTR varies significantly by query type (branded vs. non-branded), industry, and the presence or absence of AI overviews in the SERP for that specific query. Use them to identify outliers in your own data, not to compare against a single number.
|
Want us to analyze your performance on Google Search? For guidance and support from experienced SEO developers. |
| Contact us |
How Often to Review GSC (and What to Check Each Time)
Direct answer
Review Google Search Console on a weekly, monthly, and quarterly schedule. Weekly: check for sudden drops in clicks or impressions across any pages, and check the Discover report if you publish new content. Monthly: run the CTR repair workflow, check positions 4–10 for movement opportunities, review device-level performance. Quarterly: compare year-over-year trends, evaluate content gap analysis, and review the branded vs. non-branded ratio.
Weekly Check (15 minutes)
• Set the date range to the last 7 days and compare to the previous 7 days
• Look at the chart for any sudden drops or spikes
• If anything drops by more than 20%, open the Pages tab to identify which pages are affected
• Check for any new pages you published. Are they appearing in GSC impressions yet?
• Check Google’s Search Status Dashboard if you see an unexplained change
Monthly Review (45–60 minutes)
• Run the CTR repair workflow on your top 20 queries by impressions
• Review the positions 4–10 list for new opportunities
• Check the device split: are mobile and desktop CTRs moving in the same direction?
• Look at the country data if you have multiple target markets
• Check Search Console Insights for any Query Groups marked Trending Down
Quarterly Analysis (2 hours)
• Compare year-over-year clicks for your top 20 pages. Use clicks, not impressions, as your benchmark impression data before September 2025 is not comparable to data after due to the methodology change Google made at that point.
• Review the branded vs. non-branded query split: Is organic discovery growing or stagnating?
• Cross-check GSC click data against Google Analytics organic sessions to catch any data discrepancies
• Identify any pages that were ranking well six months ago but have since disappeared; these need URL inspection and content review
• Evaluate the impact of content changes you made in the previous quarter using the annotations timeline
Six Reading Mistakes That Lead to Wrong Decisions
1. Panicking Over Impression Drops Without Checking Clicks
After September 2025, impression drops may simply reflect cleaner data. Always check clicks first. If clicks are stable, the drop is noise, not a problem.
2. Trusting Average Position as a Ranking Number
A page with 500 ranking queries will show an average position that is meaningless as a benchmark. Always filter to a specific query or compare position trends directionally, not as an absolute value.
3. Rewriting Content Every Time CTR Dips
Normal weekly fluctuations of 10–15% in CTR are expected. Wait for at least three weeks of consistent underperformance before making changes. Premature edits create instability in data you cannot read.
4. Only Looking at the Queries Tab
Most diagnoses require the Pages tab. Understanding which specific pages have problems, not just which queries, is what allows you to fix them.
5. Ignoring Mobile-Specific Performance
Reporting on desktop-only performance in a market where 60–70% of searches come from mobile is reporting half the picture. Always add a device filter to any meaningful analysis.
6. Treating GSC as a Reporting Dashboard Instead of a Decision Tool
The most common failure mode: teams spend time producing GSC reports that never lead to a task being created or a change being made. Every GSC session should end with at least one specific action tied to the data. If it does not, the session was not analysis; it was observation.
Conclusion
Google Search Console is not just a reporting tool. It’s the foundation for understanding how your site actually performs in Google search. When used correctly, it shows where visibility is growing, where clicks are being lost, and which pages need attention first.
By reviewing the Search Results Performance Report, applying the right filters, and analyzing queries versus pages, you gain clarity on real search behavior, not assumptions. Metrics like impressions, CTR, and average position help pinpoint issues that traditional analytics tools miss, especially for pages that rank but don’t attract clicks.
The key is turning data into action. Fix low CTR pages, strengthen underperforming queries, improve content relevance, and track changes over time. When reviewed consistently, Google Search Console becomes a practical system for ongoing SEO improvements, not a once-in-a-while audit.
If your goal is better rankings, stronger visibility, and sustained organic growth, regular analysis through Google Search Console should be a non-negotiable part of your SEO workflow.